My Best and Worst Money Moves Ever
Jim at Blueprint for Financial Prosperity has asked everyone to share our own best and worst money moves ever.
Here are mine:
My Worst Move
Initially going into the IT consulting business with partners who could not generate consulting revenue at the rate that I could. I ended up subsidizing their salaries at my own expense which created quite a bit of anger and resentment on my part. While I did make a nice living, I cost myself a lot of income by not initially having the courage to start the business on my own.
My Best Move
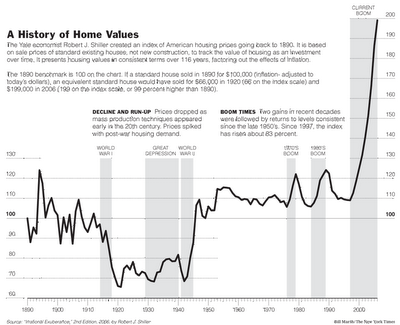
The purchase of my home. My wife and I bought our place in 1997 right before the recent housing boom started. The purchase price of our home was far more than I had intended to spend at the time, but it is now worth twice what we paid for it nine years ago.
This graph from the New York Times illustrates how fortunate we were to buy our house in 1997:
Here are mine:
My Worst Move
Initially going into the IT consulting business with partners who could not generate consulting revenue at the rate that I could. I ended up subsidizing their salaries at my own expense which created quite a bit of anger and resentment on my part. While I did make a nice living, I cost myself a lot of income by not initially having the courage to start the business on my own.
My Best Move
The purchase of my home. My wife and I bought our place in 1997 right before the recent housing boom started. The purchase price of our home was far more than I had intended to spend at the time, but it is now worth twice what we paid for it nine years ago.
This graph from the New York Times illustrates how fortunate we were to buy our house in 1997:

posted by Frugal Frugalson at
1:16 PM
![]()


4 Comments:
Wow, that's an interesting chart. I hadn't seen that before...
I bought in 1997 as well :)
By Anonymous, at 11/8/06, 2:58 PM
It might be interesting to see that same data plotted using a logarithmic scale on the Y axis.
This would present equal % changes as equal spaces on the chart.
No doubt - the graphed line will still be relecting a recent upswing, but the 'appearance' of the plot might be more useful in the financial sense.
' . . . just an idea.
By Anonymous, at 11/8/06, 4:58 PM
That chart is dramatic. It's surprising that it does not show a slightest deflection when the economy was in ruins around 2001-2002.
Anon's comment is interesting above. I might try it and see how it looks.
By GolbGuru, at 11/8/06, 9:00 PM
Plotting with a logarithmic scale?
My old Applied Engineering Mathematics professor is smiling somewhere... :p
By Frugal Frugalson, at 11/9/06, 1:52 PM
Post a Comment
<< Home